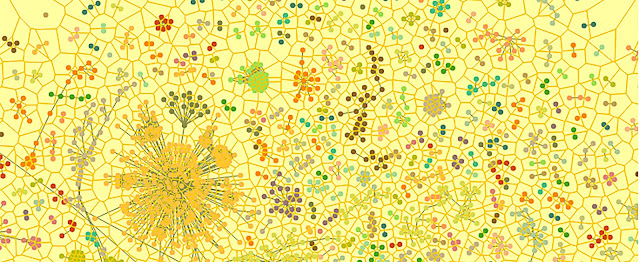
Data visualization is the art of turning data into meaningful graphics. But sometimes, this process doesn’t go as planned. When it fails in style, the results can be surprisingly beautiful. I come from an art background, so I asked myself the question: can we present datavis failures in an art gallery and treat it as a form of Glitch art? That’s what we did. And it was fun.